Sunday, May 06, 2007

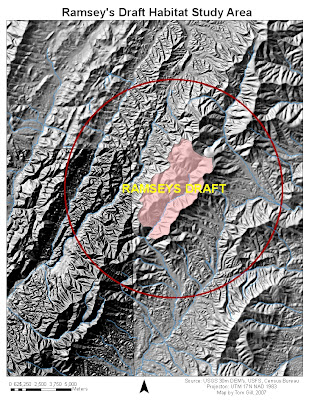
Hillshade Map of the Ramseys Draft area

Ramsey's Draft

Here's a digital terrain model I created of the Ramsey's Draft Wilderness Area in Highlan and Augusta counties, VA. I backpacked the region in 2004 with Ryan and Jeff. It is as rugged on foot as it appears here.

Sunday, February 18, 2007

Practicing Some More
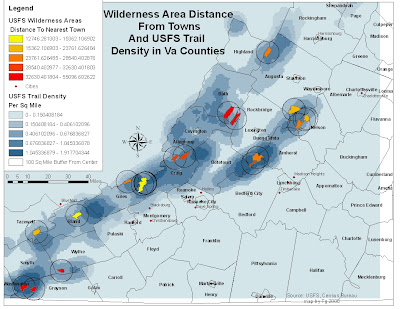


This is just some exploratory analysis as I try to learn some new tools that will eventually be used in the wolf habitat project.

The map shows the density of hiking trails per square mile, an approximately 100 sq miles buffer around each wilderness area, and wilderness areas symbolized by their distance from the nearest town point feature. This last statistic was gathered by spatially joining the two features. I am not sure what the units are in. The raster map layers I was working with were set to miles, but perhaps the unprojected point layer screwed up the calcualtion. It appears the cooler colors represent higher proximity, but if you get in there and actually measure, something isn't right. But that's why I've still got three months to do this thing.

Saturday, January 27, 2007

The Beginning of a New Project
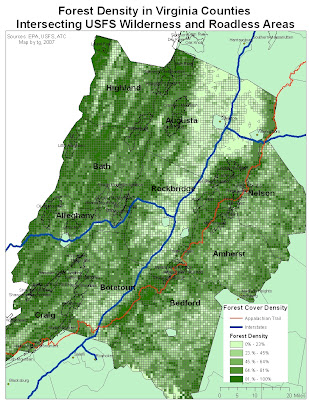


I will be doing a research project this semester identifying potential habitat for a red-wolf introduction to western Virginia.
This map is a general reference for a much, much more detailed analysis.
The forest data is derived from an EPA raster image of the US, converted to polygons then clipped to counties in Virginia that intersect USFS wilderness areas.
On this map I also included roadless areas identified by the Clinton Admin. Roadless Lands Initiative. These roadless zones are areas current VA governor Tim Kaine intends to protect.
Each grid square represents 1055 feet by 1055 feet (I think-the metadata is vague).
Click the pic to see it clearly.

Saturday, January 20, 2007

More Play
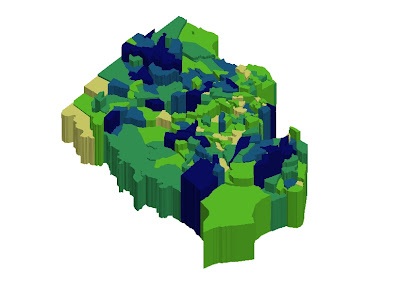

Here's a map of Fairfax County voting precincts showing John Kerry's percentage of the vote in 04.
The highest areas correspond with the highest percentage. To use voting percentage as a Z Value I had to divide it by 200 to keep the polygons at a easy to view size.
Click to see-but I don't know what I'm doing.

A Confusing Perspective


This is me fooling around with ArcGlobe, a program I know nothing about. It's the same area as before, but from a new perspective. The map is the Arcola SW and SE DOQQ's, the Herndon SW DOQQ, a Loudoun County boundary file, water lines and polys, part of a route 50 line file(in red), and underlain below it all is a USGS landcover map of Loudoun County in TIF.
ArcGlobe, as far as I can tell does not have a layout mode, thus there are no map elements included such as a scale bar or title. I am using the files for this site as experiments really to help me figure out some capabilities for my next project for school, which has nothing to do with Loudoun County.
This too, is probably more interesting if clicked on.

Friday, January 19, 2007

Yet Another View


As I continued to fiddle around, I figured out how to add contour lines to this TIN.
You need to click on these maps to see them.
These are just experiments as I learn how to use the 3D Analyst extension in ArcMap.

Thursday, January 18, 2007

Another View


I've been fooling around with 3D analyst this afternoon.
Here's the same area as a TIN.

Wednesday, January 17, 2007

Tye Dyed Landscape


Here's a psychedelic topo map I made of the route 50 corridor near the Hess Station I posted about before.


This uses a USGS 30 meter Digital Elevation Model with a vector overlay of Census street centerlines.